G GCSE Apps

GCSE Statistics

Probability

13 subtopics in this section

The probability scale (F)

Definition

All Probabilities are between 0 and 1. If something has a Probability of 0, it means it will never happen. If something has a Probability of 1, it means it definitely will happen.

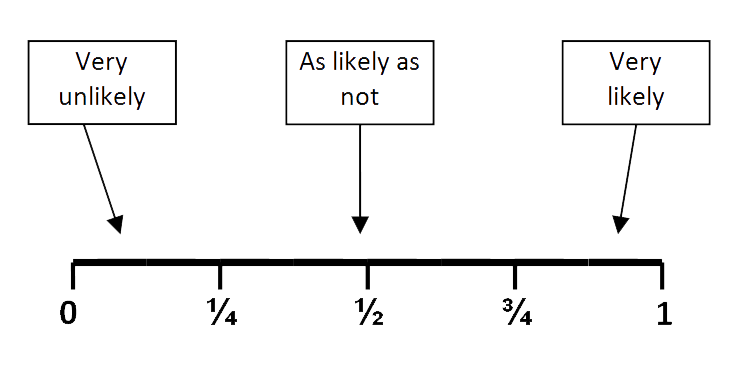
The Probability Scale runs from 0 to 1.

Diagram

probability scale diag

Note

The Probability Scale is basically a number line running from 0 to 1. The closer an event is to 0, the less likely it is to happen. The closer it is to 1, the more likely it is to happen. In the middle, with probability = 1/2, it's got the same chance of happening as not happening.

The sum of probabilities for all possible outcomes is always 1. So, if P(x) is the probability that a rolled dice lands with the number x uppermost, then P(1) + P(2) + P(3) + P(4) + P(5) + P(6) = 1

Method

Probabilities can be expressed as fractions or decimals (or sometimes percentages).

Example

Put these events in order of their probability of happening starting with the most likely first: A tossed coin lands heads up A random card picked from a deck is an Ace A dice is tossed and the number is 2 or greater

Solution

Let's look at each in turn.

The chance of a coin landing heads up is 1/2 (there are two outcomes and both are equally likely to happen)

In a deck, there are 52 cards in total, but only 4 of them are Aces so there's only a 4/52 chance of picking an ace.

On a dice, there are the numbers 1 - 6 so, 5 of those outcomes are 2 or greater. So, the chance of rolling a number 2 or greater is 5/6

So, in order of happening with the most likely first we have: A dice is tossed and the number is 2 or greater A tossed coin lands heads up A random card picked from a deck is an Ace

Probability of not an event (F)

Definition

P(Event) denotes 'The Probability of an Event Happening' A basic rule of probability is: P(Event) + P(Not Event) = 1.

This is basically common sense as it's certain (ie. Probability = 1) that an event will either happen or it won't happen.

Method

Using the rule P(Event) + P(Not Event) = 1, we can work out the probability (chance) of an event not happening by simply subtracting the probability of it happening from 1.

Example

The chance of your ticket winning a tombola prize at the school fete is 1/5. What's the chance that your ticket wins you nothing?

Solution

P(win nothing) = 1 - P(win something) So, P(win nothing) = 1 - 1/5 = 4/5

Addition rule for mutually exclusive outcomes (F)

Definition

Two events are said to be Mutually Exclusive if they can't occur at the same time.

For example, rolling a 1 and rolling a 6 on a dice are Mutually Exclusive.

The weather being sunny and it being windy are NOT Mutually Exclusive as they can both occur at the same time.

If two events, A and B are Mutually Exclusive, then P(A or B) = P(A) + P(B) So, in the example of rolling a dice, P(1 or 6) = P(1) + P(6) = 1/6 + 1/6 = 1/3

Tips/hints

Make sure you check the events are Mutually Exclusive.

Example

In a bag are 3 red balls, 4 blue balls, 5 green balls and 6 yellow balls. Jack picks out a ball. What's the chance it's red or yellow?

Solution

The ball Jack picks out can't be both red and yellow so these events are Mutually Exclusive. The total number of balls is 3+4+5+6 = 18 So, P(red or yellow) = P(red) + P(yellow) = 3/18 + 6/18 = 9/18 = 1/2

Relative frequency (F)

Definition

For some events, we know the theoretical Probability that they will occur. For example P(throw a 6 on a dice) = 1/6

For other events, there is no such theoretical figure and we either have to use historical data to find the probability (of a White Christmas, for example) or conduct our own trials.

The Relative Frequency of an event is given by the formula: Relative Frequency = Number of Occurrences of Event ÷ Total Number of Trials

Method

When you've calculated the Relative Frequency of an Event, you can then use that to predict how often the Event will occur in a future set of trials.

Look through the worked example to see this in practice.

Example

You're playing a game of Snakes and Ladders with your friend who insists on using his own dice. You think it's biased and ask to do some testing on it. You throw it 120 times and record each outcome, putting the results in the table below.

Diagram

biased dice tab

Note

(i) What is the relative frequency of the number 6? Were you right to be suspicious?

(ii) If you threw the dice 600 times, how many times would you expect to throw a 6?

Solution

(i) The Relative Frequency = Number of Occurrences ÷ Total Number of Trials So Relative Frequency of 6 = 48/120 = 0.4 Using a regular dice, P(6) = 1/6 = 0.17 so, yes, you were right to be suspicious.

(ii) Now, if there were 600 throws, we could expect a 6 in 0.4 x 600 of them ie. 240.

Combined events (F)

Definition

Combined Events are two or more Events occurring together. They don't necessarily occur at the same time

Events are said to be Independent if the occurrence of one event doesn't have any influence on the chance of the other event happening.

Putting this all together, if two events, A and B are Independent then the probability of the Combined Event, A and B happening is: P(A and B) = P(A) x P(B)

Method

Always break the combined events down into a series of single events.

For example, calculate the probability that you draw two Aces from a deck, one after the other without replacing the card. P(First card Ace) = 4/52 = 1/13 The Second Ace is slightly trickier. There are now only 3 left in the deck. Also, there are only 51 cards. So, P(Second card Ace) = 3/51 = 1/17. So, P(First card Ace AND Second card Ace) = 1/13 x 1/17 = 1/221

Tips/hints

Tree Diagrams (see Tree Diagrams module) are essential for more complicated examples of this type of question.

Another useful tool is to list all the possible outcomes. Do this in logical order to make sure you don't miss any. You could draw a table.

Example

You have two dice. One is a regular dice with the numbers 1 - 6 on its sides. The other is a tetrahedron (4 sides) with the numbers 1 - 4. You throw both dice. What's the probability you throw a double?

Solution

The best way to do this is to draw a table listing all the possible outcomes.

Diagram

tet and cube dice tab

Note

The doubles are highlighted in orange. There are 24 outcomes in total, 4 of which are doubles so P(double) = 4/24 = 1/6

Addition rule for events (F)

Definition

The Probability Addition Rule works for Mutually Exclusive Events (see Addition Rule for Mutually Exclusive Events)

If two events, A and B are Mutually Exclusive, then P(A or B) = P(A) + P(B)

Tips/hints

This can be extended to three or more events, providing each is Mutually Exclusive to all the others

Example

In a piggy bank there are 3 x £2 coins, 5 x £1 coins and 12 x 50p coins. You want to buy a magazine that costs 99p and pick a random coin out of the bank. What's the probability you can buy the magazine with that coin?

Solution

To be able to buy the magazine, the coin must be either £2 or £1. So we need P(£2 or £1). The events are mutually exclusive because the coin can't be both £2 and £1. There are 3 + 5 + 12 = 20 coins in total. So, P(£2 or £1) = P(£2) + P(£1) = 3/20 + 5/20 = 8/20 = 2/5

Calculating probabilities (F)

Definition

Calculating Probabilities is basically common sense. It looks at the chance of a particular event occurring out of all the possible events.

P(Outcome) = Number of ways Outcome can Occur ÷ Total Number of Possible Outcomes

Method

For more complex problems, count all the ways an event can occur and all the possible outcomes and divide the first by the second.

Example

You have two dice. One is a regular dice with the numbers 1 - 6 on its sides. The other is a tetrahedron (4 sides) with the numbers 1 - 4. You throw both dice. What's the probability the number on the tetrahedron is greater than the number on the regular dice?

Solution

Draw up a table of all the possible outcomes.

Diagram

tet cube dice tab2

Note

Those occurrences when the Tetrahedron's number is greater than the Cube's are highlighted in orange. In total, there are 6 of them. The total number of possible outcomes is 24. So, P(number on Tetrahedron > number on Cube) = 6/24 = 1/4

Expectation (F)

Definition

When we know the Probability of an Event occurring, we can estimate how many times it will occur in a given number of trials.

For example, we know the chance of a tossed coin landing Heads up is 1/2. So, in 100 throws, we'd expect it to land Heads up half the time ie. 1/2 x 100 = 50 times.

Expected Number of Events = P(Event) x Total Trials

Method

Simply work out the Probability of the Event you're concerned with and then multiply it by the total number of trials.

Example

You throw a dice 300 times. How many times would you expect to throw a 2?

Solution

P(2) = 1/6 So, Expected Number of 2s = 1/6 x 300 = 50

Mutually exclusive and exhaustive events (F)

Definition

Two events are said to be Mutually Exclusive if they can't occur at the same time.

Two or more Mutually Exclusive events are said to be Exhaustive if their probabilities add up to 1

For example, the outcomes of getting a Heads and getting a Tails when tossing a coin are Mutually Exclusive because they can't happen at the same time. They're also Mutually Exhaustive because P(Heads) + P(Tails) = 0.5 + 0.5 = 1

Method

Learn the definitions!

Example

Which of these events is Mutually Exclusive AND Mutually Exhaustive to drawing a Spade from a deck of cards? Drawing a Black Card Drawing a Picture Card Drawing a Heart Drawing a Club or a Red Card

Solution

A Spade is a Black Card so Drawing a Black Card is not mutually exclusive to Drawing a Spade A Picture Card could be a Spade so that's not mutually exclusive either. A Heart is mutually exclusive to Drawing a Spade but Hearts and Spades don't make up the whole deck so it's not mutually exhaustive. A Club or a Red Card - that's mutually exclusive because a Spade can't be a Club or Red. And it's mutually exhaustive because P(Spade) + P(Club or Red) = 13/52 + 39/52 = 52/52 = 1

Tree diagrams (H)

Definition

A Tree Diagram is an essential tool in solving more complex Probability problems.

We put the Probability of the particular Event along the Branch and the Event at the End of the Branch.

We start at the left with the first Event. In this instance we're picking items (without replacement) which can be either A or B. The Number of As at the start is N(A) and the Number of Bs is N(B). So, the initial Total = N(A) + N(B) and P(A) = N(A)/Total

Diagram

template tree diagram

Note

The First Pick is the set of Branches on the left. The possible outcomes, A and B go at the end of each Branch with the probability of those occurring situated alongside the relevant Branch.

For the Second Pick, we need two sets of Branches. One set for if the first pick was A, the other set for the first set being B.

In this example, we're NOT replacing A or B after they've been picked so, on the second set of Branches, if we picked A on the first Branch, there will be N(A)-1 As left on the second Branch etc. Also, the total is now Total - 1

If there is replacement after the first branch, this figures will stay as N(A), N(B) and Total

The Probabilities in the Final Column should add up to 1. If they don't, there's an error somewhere.

Method

Work through the example below to see this in practice.

Example

Dominic is trying to pick a pair of socks from his drawer which contains 6 red socks and 3 black ones. In the darkness he picks 2 socks one after the other. (i) What is the probability he has a matching pair? (ii) Given that he's picked a pair, what's the probability that it's black?

Solution

Draw a Tree Diagram

Diagram

short sock roulette tree diagram

Note

(i) To have a pair, he needs Red-Red or Black-Black P(Red-Red) = 6/9 x 5/8 = 30/72 P(Black-Black) = 3/9 x 2/8 = 6/72 So, P(a matching pair) = 30/72 + 6/72 = 36/72 = 1/2

(ii) P(Red-Red) = 30/72 P(Black-Black) = 6/72. Out of the 72 possible combinations, 30 are Red Pairs and 6 are Black Pairs (the other 36 are Red-Black combos). So, out of the 36 matching pairs, 6 are Black P(Black given that it's a pair) = 6/36 = 1/6

Independent events (H)

Definition

Two events are Independent if the occurrence of one event has no influence on the probability that the other event will occur.

For example, imagine you throw a dice and pick a card from a pack.

The 'event' of throwing a 6 on the dice and the 'event' of picking an Ace from the pack are independent. Throwing the dice to any number has no influence on which card you'll pick and vice versa.

If two events, A and B are independent, then: P(A and B) = P(A) x P(B)

Tips/hints

For more complex problems, it can help to draw a Tree Diagram or a Sample Space Diagram (the latter are particularly useful when looking at the sum/product of two dice being thrown for example).

Example

Example: A dice is thrown twice. What is the probability of the following: (i) Both throws are 6 (ii) Neither throw is 6

Solution

The two events are independent ie. it doesn't matter what you throw on the first go, it will have no influence on what your throw on the second go. So... (i) P(both throws are 6) = P(first throw is 6) x P(second throw is 6) = 1/6 x 1/6 = 1/36 (ii) P(neither throw is 6) = P(first throw isn't 6) x P(second throw isn't 6) = 5/6 x 5/6 = 25/36

At least problems (H)

Definition

Because At Least One of something occurring is Mutually Exclusive and Mutually Exhaustive to None of that something occurring, P(At Least 1 Occurrence) = 1 - P(No Occurrences)

Method

Look out for the key phrase 'At Least' in the question and then work out the chance of none. Subtract that from 1 for your answer.

Example

In a family of 5 children, if the chance of any child being a boy is 1/2, to 2 d.p., what is the chance of at least one boy in the family?

Solution

Key phrase 'At Least' is in the question so calculate the chance of none. That is, P(No boys in the family) The sex of each child is independent of the others and P(boy) = P(girl) = 1/2 So, P(No boys) = P(All girls) = 1/2 x 1/2 x 1/2 x 1/2 x 1/2 = 1/32 So, P(At least one boy) = 1 - 1/32 = 31/ 32 = 0.97 to 2 d.p.

Conditional probability (H)

Definition

If the outcome of one event is dependent on the outcome of another, it's Conditional on the other event happening and so its probability is Conditional on the other event occurring

Method

You've just got to knuckle down and use a Tree Diagram except for the simplest of problems.

A simple problem such as what is the chance of picking a Spade from a deck of cards followed by another Spade if you don't replace the first card?

Here P(first Spade) = 13/52 = 1/4 For the second card, there are only 12 Spades left out of 51 card so, P(second Spade) = 12/51 = 4/17. So, P(both Spades) = 1/4 x 4/17 = 1/17

Example

Dominic is trying to pick a pair of black socks from his drawer which contains 6 red socks and 3 black ones. In the darkness he picks 3 socks one after the other. To 2 d.p., what is the probability he has a black pair?

Solution

Draw a Tree Diagram

Diagram

sock roulette tree diagram

Note

The combinations which give him a pair of black socks are as follows with the accompanying probabilities: Red Black Black: 6/9 x 3/8 x 2/7 Black Red Black: 3/9 x 6/8 x 2/7 Black Black Red: 3/9 x 2/8 x 6/7 Black Black Black: 3/9 x 2/8 x 1/7 This becomes: (36 + 36 + 36 + 6)/(7 x 8 x 9 ) = 114/504 = 0.23 to 2 d.p.

Test yourself on this topic

Try the free quiz with worked solutions.

Start quiz →

Get GCSE Statistics

Full notes, full question bank, offline.