G GCSE Apps

GCSE Statistics

Data Collection

4 subtopics in this section

Collecting data (F)

Definition

The way Data is Collected depends on the type of Data it is.

Observation

Used to record behaviour, events or physical characteristics. Example: To find out how often rush hour trains run late.

Survey

Used to find out information that can't be accessed in existing databases Example: To find out the favourite TV programme of your classmates

Experiment

Used to test something for which the outcome can't be predicted. Example: To find out if a dice is biased towards a particular number

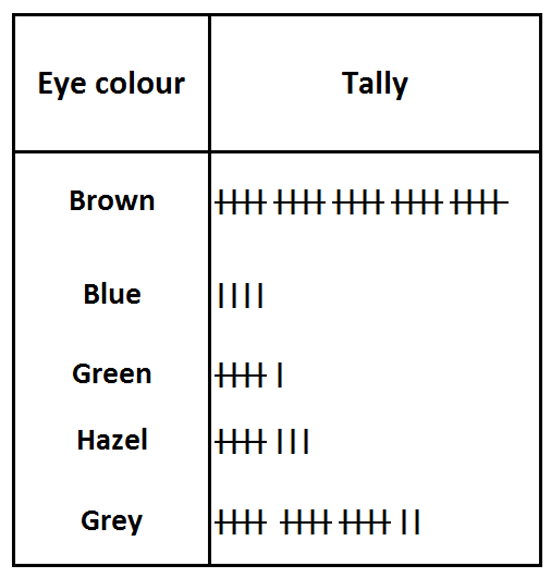
When gathering data, you need to record it accurately. A tally chart is a good way of doing this. Here, the eye-colour of a population has been observed.

Diagram

tally chart def

Note

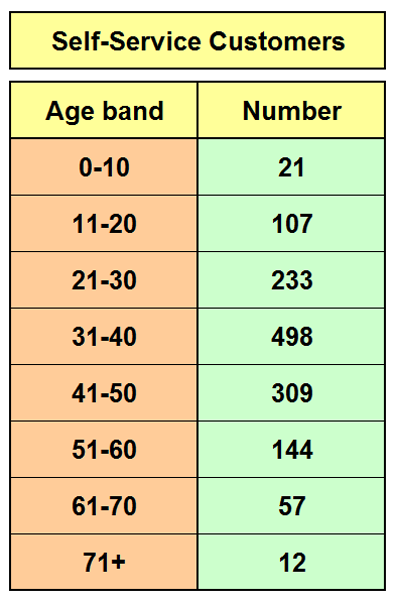
Once collected, numerical data can be grouped into bands. Although some accuracy is lost, it makes the data easier to handle and interpret. Here a supermarket has surveyed customers passing through the self-service checkouts.

Diagram

grouped data def

Method

Learn all the definitions above. Record and read data carefully.

Example

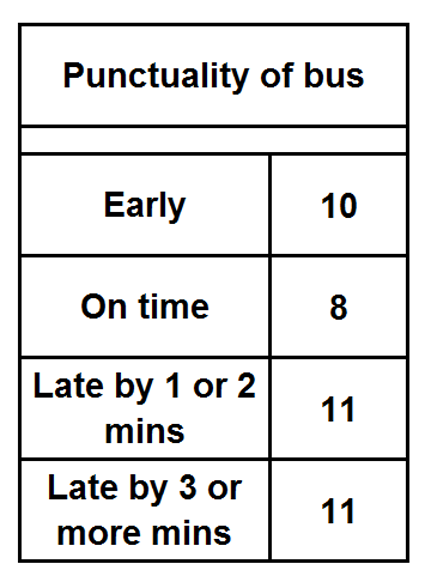
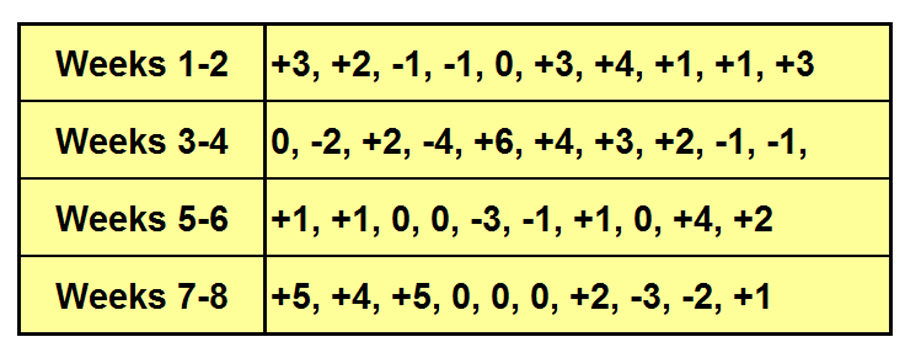
Glenn is certain his bus is late every morning so he decides to monitor it for 8 weeks. He records how late/early/on time it is each morning. Here is his raw data (+ means late, - means early. 0 indicates the bus was on time)

Diagram

raw data ex

Note

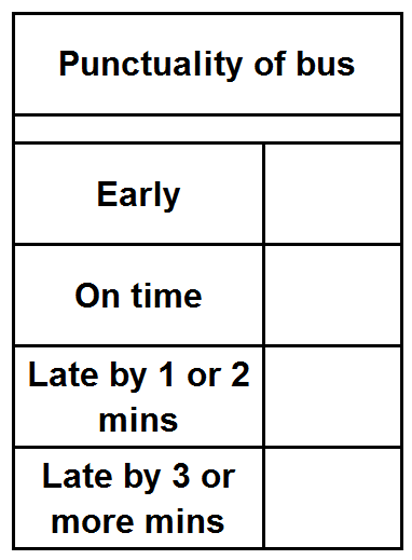
He decides to convert the raw data into a grouped frequency table. Fill in the frequency table.

Diagram

grouped data ex

Solution

Count the number in each of the groups. Your table should look like this.

Diagram

grouped data sol

Data and data collection (H)

Definition

Data comes in all shapes and sizes. The following are definitions you need to know:

Quantitative Data can be measured with Numbers (think Quantity) Examples: weights of apples, lengths of football pitches

Qualitative Data has no numerical value Examples: eye colour, favourite chocolate bar

Primary Data is data you gather yourself

Secondary Data is information you've got from another source eg. the National Census

Discrete Data can only take certain values Examples: number of cars per household, times visited cinema in last year

Continuous Data can take any value over an interval Examples: heights of trees, weights of babies

Method

Learn the definitions and examples for each type of data

Example

Give two words to describe each of the following sets of data: (i) You've surveyed your class to find out their favourite flavour of crisps (ii) You've got data from the last National Census to find out the number of people living in each house on your street

Solution

(i) It's Primary because you've done the survey yourself, It's Qualitative because the crisp flavours aren't numerical

(ii) It's Quantitative because it's numerical. It's discrete because the data can only take whole number values And an extra one, it's Secondary because you've not collected the data first hand

Surveys (H)

Definition

A Survey is a means of gathering data about people. Surveys can be conducted in a number of ways. Each has pros and cons.

Face-to-Face Interview: Pro: It ensures people understand and answer the questions Con: Costly and labour-intensive

Online questionnaire: Pro: It's cheap. It can reach a large number of people Con: Can't guarantee people will understand or answer the questions. Not everyone has access to the internet.

Postal form: Pro: It's relatively cheap and can reach a lot of people. Con: It's difficult to collect the data - people might not return them

Other issues with surveys are the Questions themselves. They need to be: Relevant Unbiased Non-personal Not open to interpretation

Giving people a choice of answers or a scale on which to rate opinions are both good ideas

Method

Follow the guidelines above when writing the questions to ask. Make them to the point and unambiguous.

Example

Name two types of survey that are relatively cheap to conduct. Give a downside to each.

Solution

Online surveys and postal surveys are both relatively cheap. The downside to an online survey is that only certain parts of the population use the internet. The downside to a postal survey is that people might not understand the questions.

Sampling (H)

Definition

Often the Population (not necessarily people) we want to find out about is simply too big. If this is the case, we take a Sample.

A Sample should be representative of the whole Population otherwise our results will be biased. It should also be of a sufficient size to represent the whole Population.

The main types of sample are:

Random: The Sample is chosen at random.

Systematic: Similar to Random but every nth member of the Population is chosen

Stratified: The Population is broken down into categories (strata), for example by age, and representative numbers from each category are used in the sample.

Method

Learn the different forms of Sampling and learn what makes a bad sample.

Also, apart from the selection of the Sample, think about where a survey is conducted, what question is asked, how it's asked (eg. if it's via the internet, think of the types of people who'll be most likely to complete it)

Example

The table shows the different people who use a particular gym on weekday afternoons. The gym wants to conduct a representative survey of these customers. If 3 men aged 51-60 are surveyed, how many women in this age group should be surveyed?

Diagram

strat ex

Solution

This is quite straightforward. In the total Population, there are 12 men aged 51-60 and 24 women in this age group, ie. twice as many women as men. So the sample should reflect this. Therefore there should be 2x3 = 6 women in this age group surveyed.

Test yourself on this topic

Try the free quiz with worked solutions.

Start quiz →

Get GCSE Statistics

Full notes, full question bank, offline.