Congruent shapes
Definition
Two shapes are Congruent if they're the same size and shape. They can be rotated or reflected but they must be the same size and shape.
Diagram
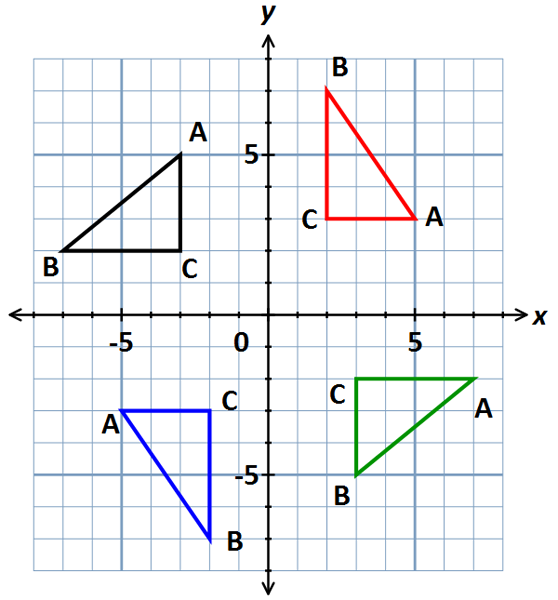
Note
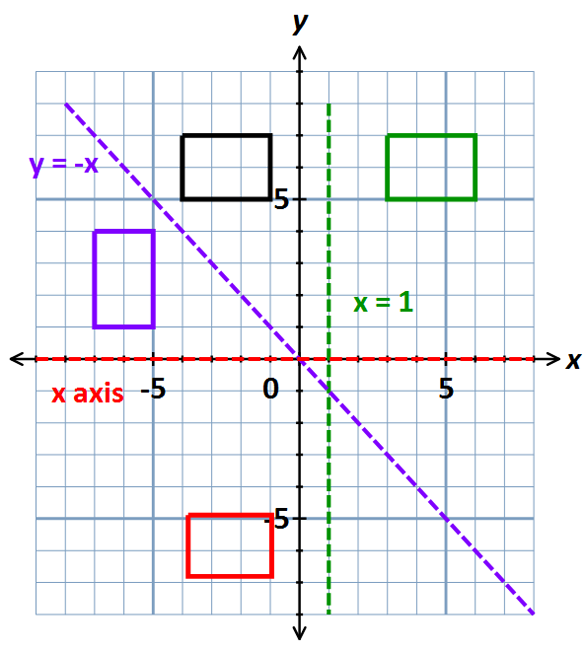
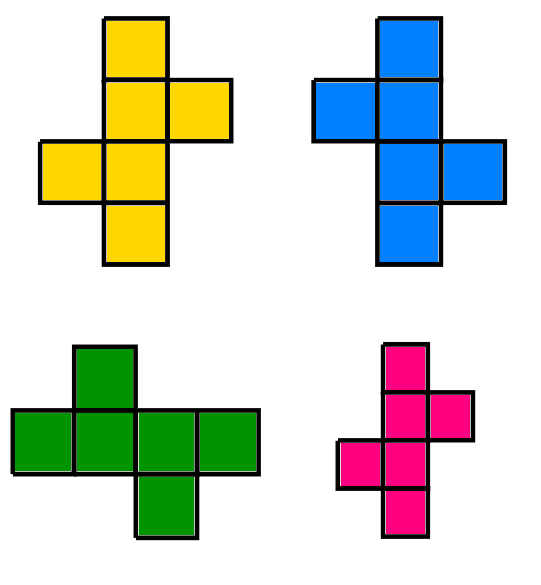
In the diagram above, the Blue shape is Congruent to the Yellow one as it's the same shape and size, it's just been reflected. The Green shape is also Congruent to the Yellow one (and the Blue one) - it's the Yellow one rotated through 90° The Pink shape, though it's similar to the Yellow, it's not Congruent as it's not the same size.
Method
Just remember, Congruent means same shape AND size. Similar means just same shape.
Example
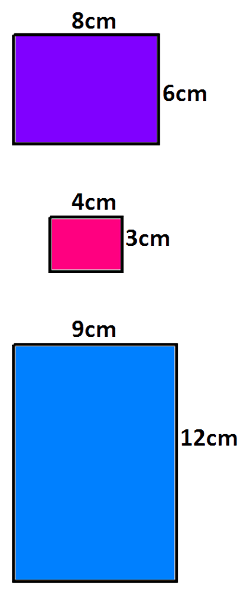
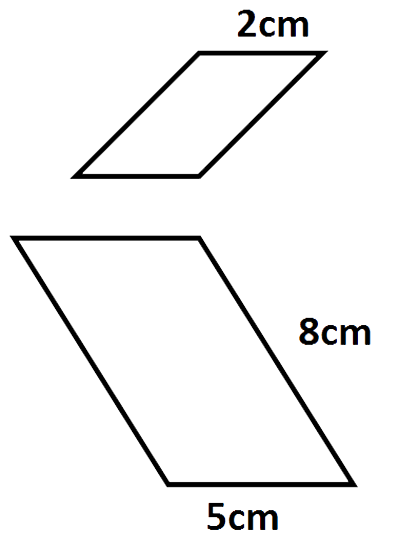
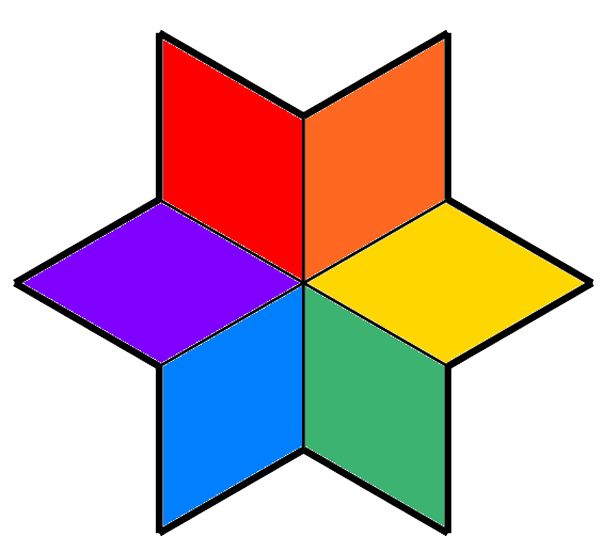
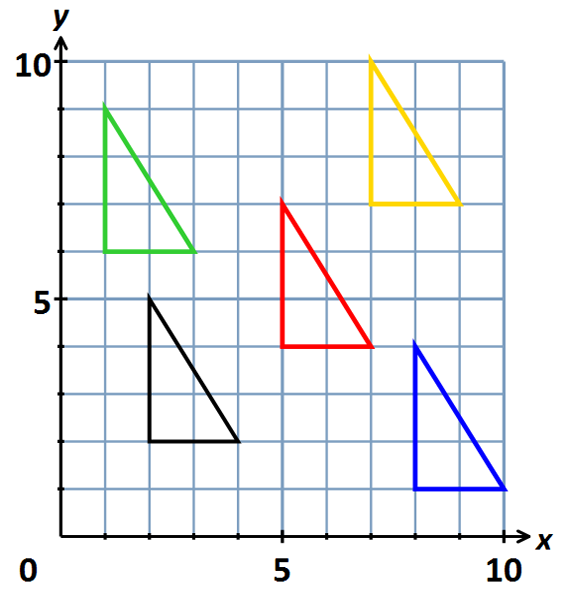
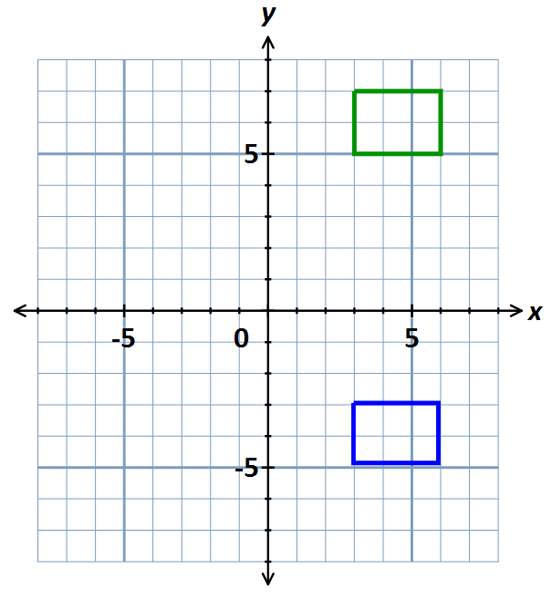
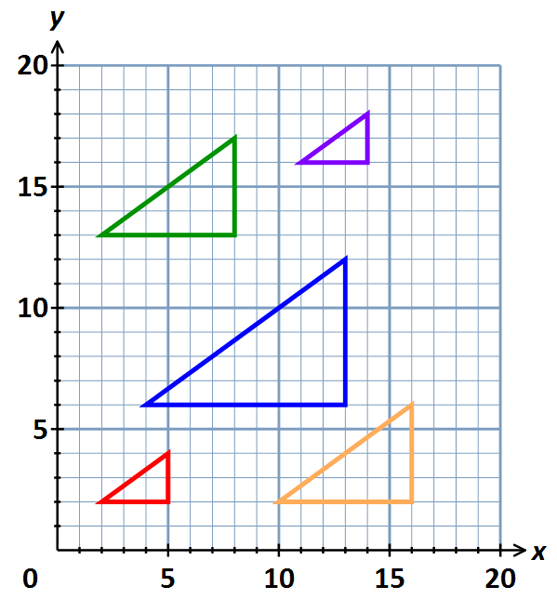
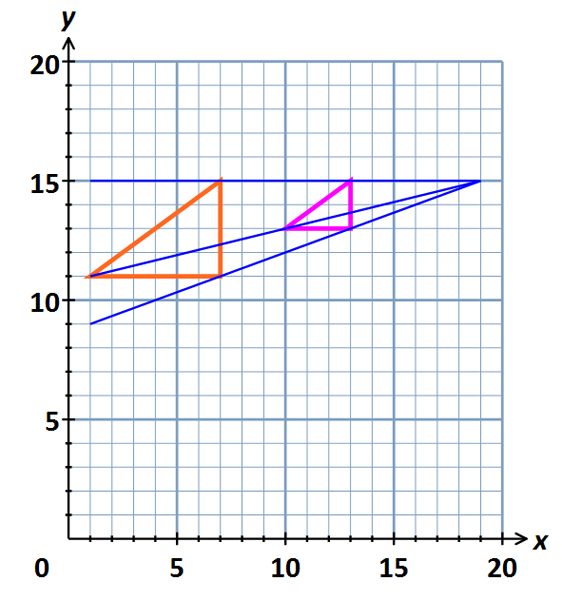
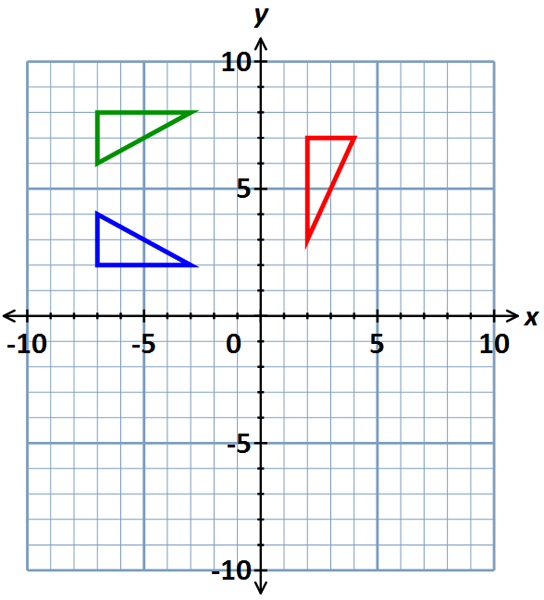
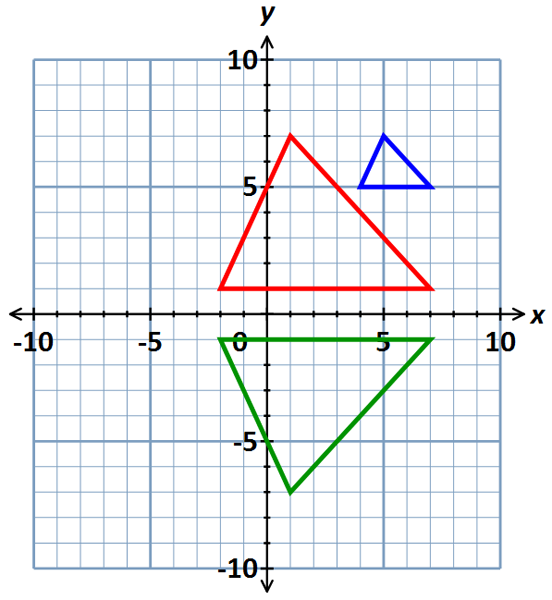
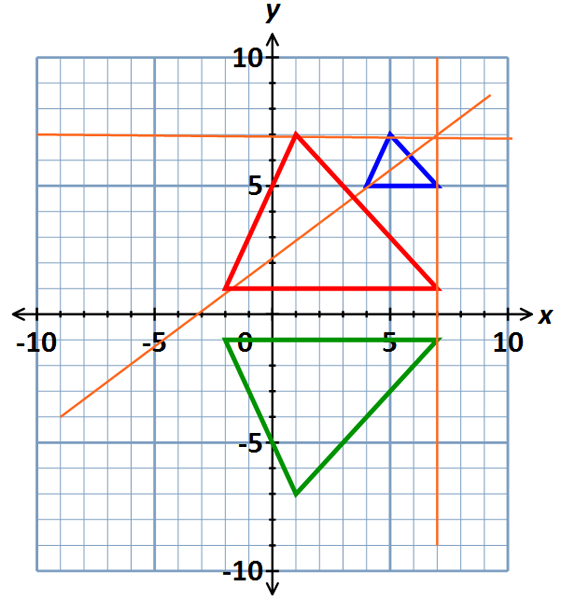
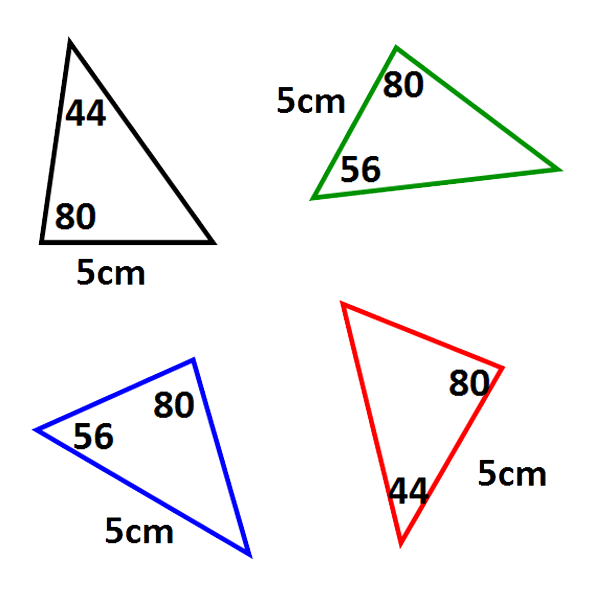
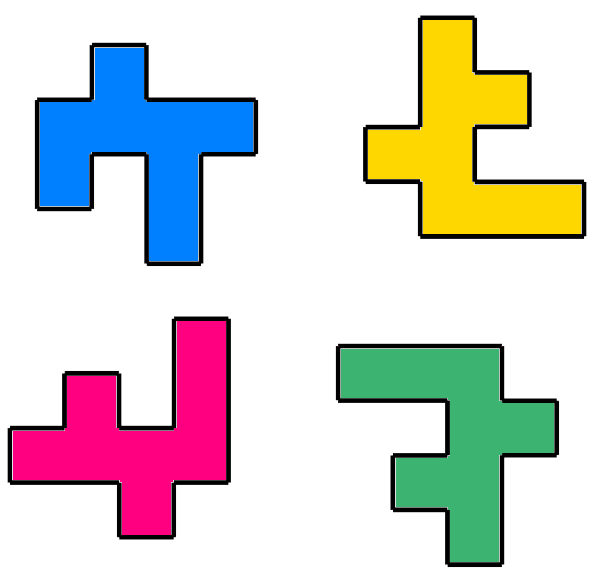
Which shapes are congruent to the blue one?
Diagram
Solution
None of them! The pink, yellow and green shapes are all congruent to one another but not to the blue shape.