G GCSE Apps

GCSE Algebra

Graphs (H)

14 subtopics in this section

3D coordinates

Definition

In the (x, y) coordinate plane, there are 2 dimensions, one along the x axis and one along the y axis. Any point in this plane can be located using an x coordinate and a y coordinate. And we can draw 2 dimensional curves, and shapes in the plane.

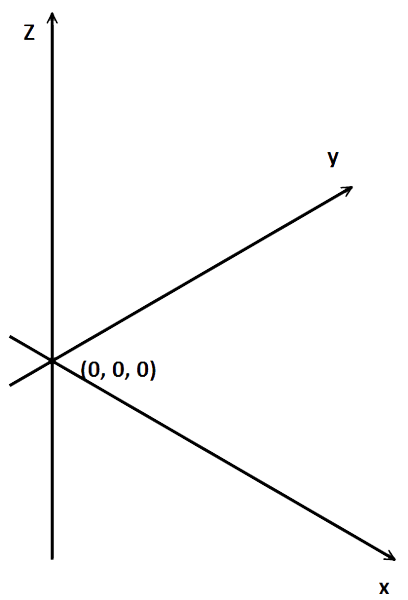
However, we can't draw 3 dimensional objects or curves in this plane. To do that, we need to add an extra dimension. This runs along the z axis. The (x, y) coordinate plane becomes horizontal and the z axis is perpendicular to it.

Diagram

3D axes

Note

3 dimensional coordinates are given as (a, b, c) which represents the x, y, z coordinates.

Method

Use 3 dimensional coordinates in exactly the same way as 2 dimensional.

Example

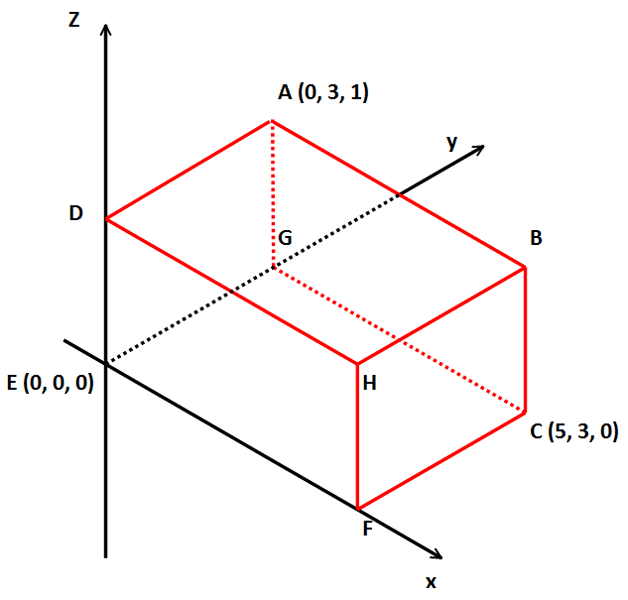
ABCDEF is a cuboid. The coordinates of A are (0, 3, 1) and the coordinates of C are (5, 3, 0). Find: (i) the x coordinate of B (ii) the z coordinate of G (iii) the point with coordinates (5, 0, 1)

Diagram

cuboid 3

Solution

(i) Because ABCDEF is a cuboid, B (and H and F for that matter) has the same x coordinate as C so, B's x coordinate is 5

(ii) The z axis is the vertical axis. G lies on the (x, y) plane (along the y axis from E) so its z coordinate is 0

(iii) The point with coordinates (5, 0, 1) must be either D, H or F as its y coordinate is 0. Its x coordinate is 5 so it must be H or F. Its z coordinate is 1 so it must be H (F has a z coordinate of 0) So, point H has coordinates (5, 0, 1)

Parallel and perpendicular lines

Definition

Let y = mx + c and y = nx + d be the equations of two lines. The lines are parallel if their gradients are the same ie. if m = n They are perpendicular if the product of their gradients is -1 ie. if m = -1/n

Diagram

parallel and perp lines

Note

In the diagram, the blue lines are all parallel to each other. They all have gradient 2 so their equations are all y = 2x + c with c varying for each line. Similarly, all the red lines are parallel to each other. Their gradient is -1/2 so their equations are y = -x/2 + c

Because the gradient of the blue lines is 2 and that of the red lines is -1/2, the blue lines are perpendicular to the red ones (the product of their gradients is (2)x(-1/2) = -1).

Method

As long as you remember that parallel lines have the same gradient and the product of the gradients of perpendicular lines is -1, you can answer questions using existing knowledge.

Example

Find the equation of a line which is perpendicular to y = 2 - x and passes through the point (0, 1)

Solution

The gradient of y = 2 - x is -1 So the gradient of the line we're looking for is -1/-1 = 1

So our line is y = x + c We know it passes through (0, 2) so, c = 2 So, the equation we're looking for is y = x + 1

Gradient-Intercept method

Definition

A Linear graph's equation can be expressed in the form y = mx + c where m is the gradient and c is the y-intercept, ie. the value of y when x = 0

To draw a line using the Gradient Intercept method, plot the y-intercept and then draw a line through it with the given gradient (see the module Drawing a Line with a Given Gradient)

Method

Make sure you can quickly find the gradient and y-intercept of any linear equation.

The key thing to finding the gradient is to get the equation in the format y = mx + c

Example

What is the gradient and y-intercept of the line 3x + 4y = 2?

Solution

Rearrange the equation to get the y term on its own on one side. 4y = 2 - 3x Now divide through by 4 so y = 0.5 - 0.75x

So, the gradient is -0.75. When x = 0, y = 0.5 so the y-intercept is (0, 0.5)

Drawing a line with a given gradient

Definition

A Linear graph's equation can be expressed in the form y = mx + c where m is the gradient and c is the y-intercept, ie. the value of y when x = 0

We can easily draw a graph by plotting the y-intercept and then using the gradient to work out which other points to plot.

Remember that the gradient, m is the amount y changes when x increases by 1.

Method

If the equation you've been given isn't in the form y = mx + c, rearrange so that it is.

The first thing to do is to plot the y-intercept ie. the point at which the line crosses the y axis. This has coordinates (0, c). Now, from this point, go along by 1 unit along to the right and up by m units (if m is negative, you'll go down)

Plot this new point and then repeat the process. Draw a straight line through the 3 points. If they're not in a straight line then you have a problem. Check all your workings to find the error.

Look through the worked example to see this in practice.

Example

Plotting the y-intercept and then using the gradient, draw the graph of the equation 2x - y = 1

Solution

Get the equation into the correct format ie. y = 2x - 1

So, the gradient is 2 and the y-intercept is at (0, -1).

Plot this point (blue). Now, go along by 1 unit to the right, and up by 2 (the gradient). Plot this next point (red) Go along 1 more unit to the right and up by 2 and plot the third point (green)

Diagram

draw with a grad ex

Note

Now draw the line through them and label as 2x - y = 1

Finding the equation of a line from its graph

Definition

In the same way that a graph can be draw when we know the equation of a line, we can work out the equation of a line from its graph. The basic equation of a straight line graph is y = mx + c where m is the gradient and c is the y-intercept

So, when presented with a straight line graph, to find its equation, we find the y-intercept and gradient and put those into the standard equation

Method

First, note down the coordinates of the y-intercept (this will give you c) Now find another point, ideally one with whole unit coordinates.

Calculate the gradient of the line joining these points (see the module Gradients for how to do this). Now you have the value of m and c Put these into the equation y = mx + c to get the equation of the line.

Example

Find the equation of the line shown.

Note

2y eq 6 - 3x

Solution

We're looking for an equation in the format y = mx + c The y-intercept is (0,3) so c = 3 The graph also passes through (2, 0). So, the gradient is (0-3)/(2-0) = -3/2 = m

So the equation of the graph is y = -3x/2 + 3

Uses of graphs- finding formulae or rules

Definition

As with graphs of equations in the format y = mx + c we can work out the formulas of many real life graphs that represent formulas or rules.

Method

If it's a straight line graph, find the gradient and y-intercept in the usual way.

If it's a more complex graph, you're likely to be told a basic formula and asked to work out some constants eg. the formula is K = at² + b where K varies with t and a, b are constants.

In this instance, find a couple of points on the graph and plug the coordinates into the equation. From this you'll be able to work out a, b

Example

A taxi firms charges a flat call out fee and then a fixed rate for each mile travelled. Looking at the graph below, work out: (i) The call out charge (ii) The rate for each mile travelled (iii) The formula for the cost of a journey

Diagram

taxi ex

Solution

(i) First let's write a word equation: Total Cost = Call Out Charge + Miles x Rate per Mile

Putting this into an algebraic equation where T = the Total Cost, d = miles travelled, c = call out charge and r = rate per mile we have: T = c + rd. T and d are the variables (Total Cost and Miles Travelled) c and r are constants (Call out fee and Rate per Mile)

Look at the graph when d = 0 (ie. when there are no miles travelled) T = c But, T = 2 so, c = 2. That is the Call Out Charge is £2

(ii) Now let's look at another point on the graph, when d = 10, say. Look at the graph at this point and read along to find the y value. It's 17

So, when d = 10, T = 17. Put this into our equation and we get 17 = 2 + 10r This makes r = 1.5 So, the rate per mile is £1.50

(iii) We have r and d so the formula for the cost, T, of a journey is T = 1.5d + 2 where d is the miles travelled.

Significant points of a quadratic graph

Definition

A Quadratic Graph with the equation y = ax² + bx + c has a number of significant points.

Diagram

quad graph sig pts

Note

Where it crosses the x axis are the points where y = 0 and so are the roots of the equation ax² + bx + c = 0. If it doesn't cross the x axis, the equation has no roots.

Sometimes a quadratic graph just touches the x axis at its maximum/minimum point. In this case it has one root.

The y-intercept is the point where it crosses the y axis ie. where x = 0.

And finally there's the maximum or minimum point (depending on the shape of the parabola).

Tips/hints

Make sure you use the scale correctly and be careful when reading negative values.

Example

Use the graph to find the following points: (i) Roots of the equation 12 - 4x - x² = 0 (ii) The y-intercept of y = 12 - 4x - x² (iii) The maximum value of the expression 12 - 4x - x²

Diagram

sig quad pts ex

Solution

The points are all indicated here.

Diagram

sig quad pts sol

Note

For (iii), the maximum value of the expression 12 - 4x - x² is just the y coordinate of the maximum value ie. 16

Cubic graphs

Definition

A Cubic Graph is one with an equation in the form: y = ax³ + bx² + cx + d

Unlike some quadratic graphs, all cubic graphs cross the x axis at least once, some cross it three times.

Diagram

3 cubic graphs

Note

They all have either two bumps (red and blue) or a flat bit (green) in the middle.

If the constant a in the equation is positive, the graph basically goes up from left to right (apart from the bumps in the middle) (green, blue). If it's negative, the graph goes down from left to right (red).

Method

You should be able to draw up a table of values for a cubic graph and plot the graph using those values.

Tips/hints

If the equation of the graph is complicated, put several steps in the table (see the worked example).

Example

Draw up a table of values for the equation y = x³ - 2x² - 3x + 2 for integer values of x from -2 to 3 inclusive.

Solution

Each part of the equation has been given its own row in the table. This makes mistakes less likely (in theory!)

Diagram

tab for cubic

Note

Now plot the points

Diagram

cubic sol a

Note

This is why you need to know the shape of a cubic graph. The x³ coordinate is positive so the graph basically increases from left to right.

From the points plotted, we can see that the graph crosses the x axis 3 times so it has 2 bumps.

With a steady hand, join the points with as smooth a curve as possible. You should hopefully get something like this

Diagram

cubic sol b

Exponential graphs

Definition

An 'exponential graph' is simply the graph of a function of the form .

a, b will usually be integers, often with a = 1.

Diagram

y eq 3 exp x

Note

The above is a typical exponential graph. It rises sharply as x increases and it tends towards zero as x decreases. Although as x decreases it gets closer and closer to 0, it never actually touches the x axis.

Method

If you're asked to draw a graph, you will probably have to create or at least complete a table of values. Do this carefully and check when you plot the points that they form a smooth curve. If not, then you might have calculated one of the values incorrectly.

You may be asked to read values from a given graph (or one you've drawn) which is the same as reading values from any other type of graph.

Or, more trickily, you may be asked to work out a and/or b using the graph of . To do this, find the value of y for two different values of x and substitute these in the given equation to get a pair of simultaneous equations in a and b. Solve these equations for the answer.

Note

y eq 0 pt 5 mult 2 exp x

Example

The graph shown has been obtained using experimental data and appears to be of the form . Use the graph to find the constants a, b.

Solution

Firstly look at the graph when x = 1. y = 1 so putting these values into the original equation we get 1 = ab. Now look at x = 2. In this instance, y = 2 so, 2 = ab²

From the first equation we know ab =1 so substituting this into the second we get 2 = b. Substitute this back into the first to see that a = 0.5

Reciprocal graphs

Definition

A Reciprocal Graph is one of an equation y = a/x which can also be written xy = a (a is a constant)

Note

y eq 1 over x_y eq -1 over x

There are two halves to each graph and the halves never touch. Also, the graphs are always symmetrical about the lines y =x, y = -x (the diagonals through the origin)

Method

To draw a graph, create a table of values. Plot the points and then try to join them with a smooth curve (or two smooth curves if plotting both halves).

You may be asked to read values from a given graph (or one you've drawn) which is the same as reading values from any other type of graph.

Or, more trickily, you may be asked to work at a in the equation y = q/x. To do this, find the x, y coordinates of a point and plug them in the equation. This should give you a

Tips/hints

The graphs aren't defined when x = 0 or y = 0 because you can't divide by 0.

And don't forget the two halves of the graph don't touch.

Example

Complete the table of values for the graph y = 60/x and use it to draw the graph of the function for x > 0, y > 0

Note

tab inc y eq 60 over x

Solution

The completed table should look like this:

Diagram

tab y eq 60 over x

Note

Plot the points and join them as smoothly as possible. Don't forget, the graph never touches the axes.

Diagram

y eq 60 over x

Graphs of loci and trig functions

Definition

A Locus (plural Loci) is a set of points that follow a given rule. It usually takes the shape of a line or curve.

A circle is the locus of the set of points that are a fixed distance (= the radius) from a given point (the centre).

This can be represented algebraically by the equation (x - a)² + (y - b)² = r² where r is the radius of the circle and (a, b) is the centre.

Diagram

circle centre 1 2 rad 3

Note

If the centre of the circle is at the origin, (0, 0) then the equation becomes x² + y² = r²

Straight lines can also be loci. For example, the locus of the set of points that are a distance of 4 from the x axis is the line y = 4

Diagram

y eq 4

Method

Try and learn the definition of a circle and its equation as it can be quite tricky to work out without a starting point.

With straight lines sometimes it's easiest to work out an equation from the information given and then draw the locus.

For example: Draw the locus of the set of points whose y coordinates are 3 times their x coordinates.

Writing this algebraically, y = 3x so that's the line we need to draw.

Example

Draw the locus of the set of points which are equidistant from the y axis and the line x = -4

Solution

The first thing to do is draw the information you're given.

Diagram

x eq -4

Note

So, we need to find the set of points that are equidistant from two parallel lines, x = -4 and the y axis. This is simply a third parallel line that runs between the two of them, in this case, the line x = -2

Diagram

x eq -4 x eq -2

Solving equations by the method of intersection

Definition

As you probably know by now, there are many ways to solve an equation.

The Method of Intersection uses two graphs that intersect to solve the equation of a third.

Diagram

meth of inter def

Note

Here, the graphs are of the equations: y = x² - 4x - 5, y = x + 2

They intersect when x² - 4x - 5 = x + 2 ie. when x² - 5x - 7 = 0 so the x coordinates of the points of intersection are the roots of the equation x² - 5x - 7 = 0

Method

Usually you'll be presented with the graph of a quadratic function and asked to draw a line to solve another quadratic function. You decide which line to draw as follows:

Let the equation of the graph be y = ax² + bx + c Let the equation to be solved by px² + qx + r = 0

Usually, p = a = 1. If this is not the case, divide/multiply as necessary in the second equation to make p = a So, now let's assume that p = a and we'll write the second equation: 0 = ax² + qx + r

Now take this away from the first to get y = (b - q)x + (c - r)

This is the equation of the line you need to draw. Look through the worked example to see it in practice.

Example

By drawing a suitable line on this graph, solve the equation: x² + x - 9 = 0 to 1 d.p.

Diagram

meth of inter ex

Solution

Write out the two equations starting with the graph: y = x² + 3x - 6 0 = x² + x - 9 Subtract the second from the first to get y = 2x + 3 This is the line you need to draw

Diagram

meth of inter sol

Note

Look at the x coordinates of the points of intersection. These are 2.5 and -3.5 to 1 d.p.

Sine and cosine graphs

Definition

The Sine (Sin) and Cosine (Cos) Graphs are the graphical representations of the trigonometric functions. They are identical in shape but shifted along the x axis from each other

Note

y eq sin x y eq cos x

As you can see, they both repeat every 360°

The key thing to note to distinguish them is sin(0°) = 0 and cos(0°) = 1

Method

You should be able to sketch these graphs and read values from them.

Example

Use the graphs to determine the angle A such that between 0° < A < 180° and sin(A) = cos(A)

Note

y eq sin x y eq cos x

Solution

The sin and cos value of an angle will be the same at the points where the graphs intersect. The only tricky thing here is the scale.

In the range 0° to 180° the graphs intersect just once. The major lines of the scale are every 180° and inbetween, they're divided into 4 sections so each section represents 180°/4 = 45°

So, the angle we're looking for, A, is 45°

Transformations of the graph y = f(x)

Definition

A Transformation of a graph y = f(x) can be one of four types. We'll consider each one with the function f(x) = x²

The basic graph looks like this:

Diagram

y eq x sq

Y Shift

Now, look at y = f(x) + a, in our example y = x² + a If a > 0 the graph is shifted up the y axis by a (red), it a < 0 it's shifted down the axis (green).

Note

y eq x sq pl 4 y eq x sq min 4

Y Stretch

Now look at y = kf(x), in our example y = kx². If k > 1, the graph is stretched along the y axis (red), if it's < 1, it's squashed in the y direction (green).

Note

y eq 3 x sq y eq x sq over 3

X Shift

Now look at y = f(x+a), in our example y = (x + a)² Here we're directly altering x by a. Every instance of x in the equation will be replaced by x + a.

These are tricky because If a > 0, the graph is shifted to the left ie. in a negative direction (red) and if a > 0, it's shifted to the right, ie. in a positive direction (green) Not very intuitive

Note

y eq x pl 3 sq y eq x min 3 sq

X Stretch

Finally, consider y = f(kx), in our example y = (kx)². These also go 'the wrong way'.

If k > 1 it squashes the graph up along the x axis (red) and when it's < 1, it stretches it out (green)

Note

y eq 2x sq y eq x over 2 sq

Method

Although the examples above are given for f(x) = x² the same applies for all functions f(x) You simply have to learn the effect each of the four transformations has on a graph.

Tips/hints

If you can't remember what a transformation does, do a sketch of a simple function to remind yourself.

Example

The black graph is that of y = cos(x) What's the equation of the orange graph?

Note

y eq cos x y eq cos x over 2

Solution

First, work out what sort of transformation it is. It's a stretch along the x axis. So, it's of the form y = cos(kx) Now, because it's stretched and not squashed, k < 1

Each cycle of the orange graph takes twice as much of the x axis as the black graph so it repeats half as often. Thus k = 1/2 so the orange graph is that of y = cos(x/2)

Test yourself on this topic

Try the free quiz with worked solutions.

Start quiz →

Get GCSE Algebra

Full notes, full question bank, offline.