G GCSE Apps

GCSE Algebra

Graphs (F)

12 subtopics in this section

Negative coordinates

Definition

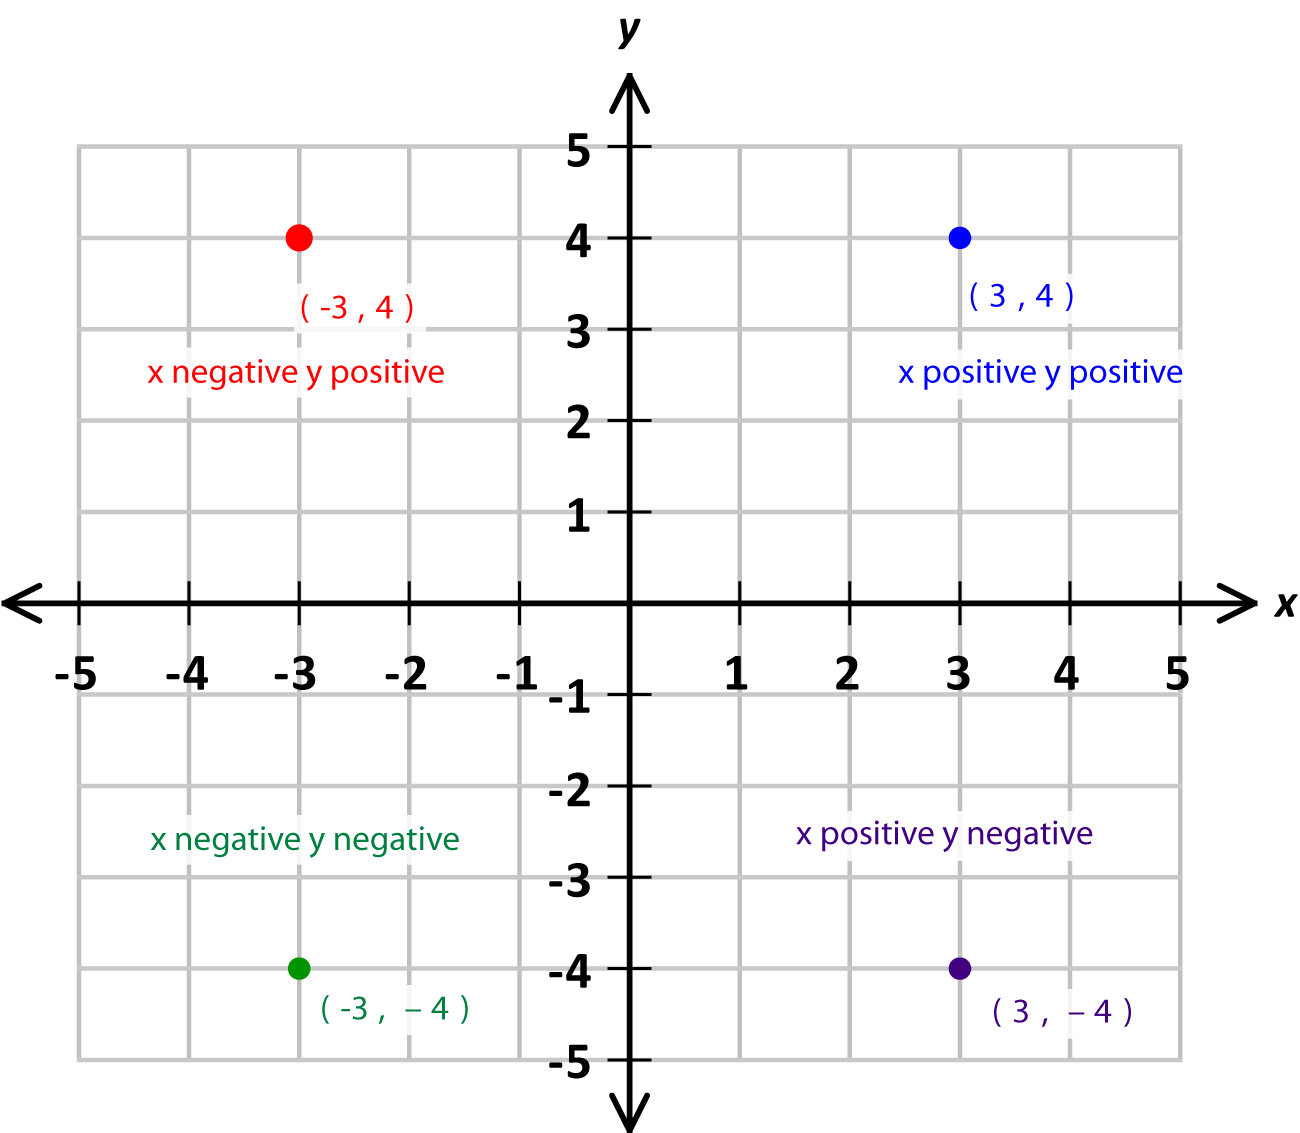
The coordinate plane is divided by the x and y axes into 4 different regions. Look at the diagram to see how the signs of the x, y coordinates change depending on which region a point is in.

Diagram

4 points in coord plane

Method

Remember to label the axes and to put some values on them. The origin, where the axes intersect is the point (0, 0) (the x coordinate is always given first). x values increase from left to right, y values increase from bottom to top.

Example

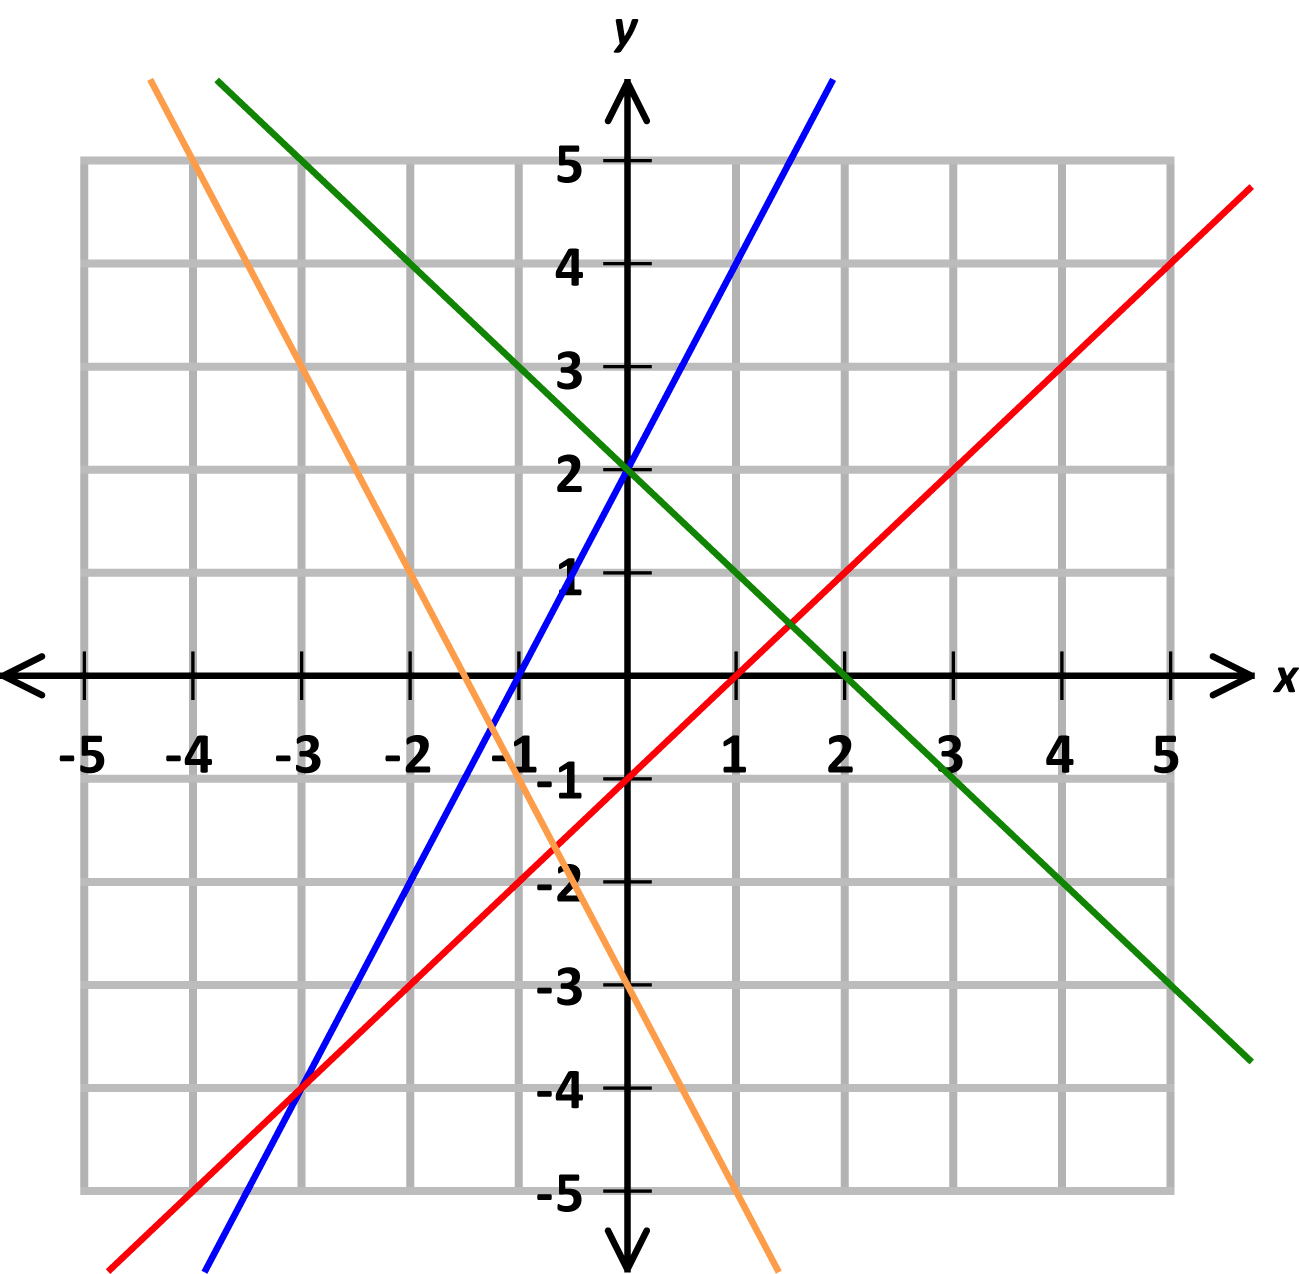
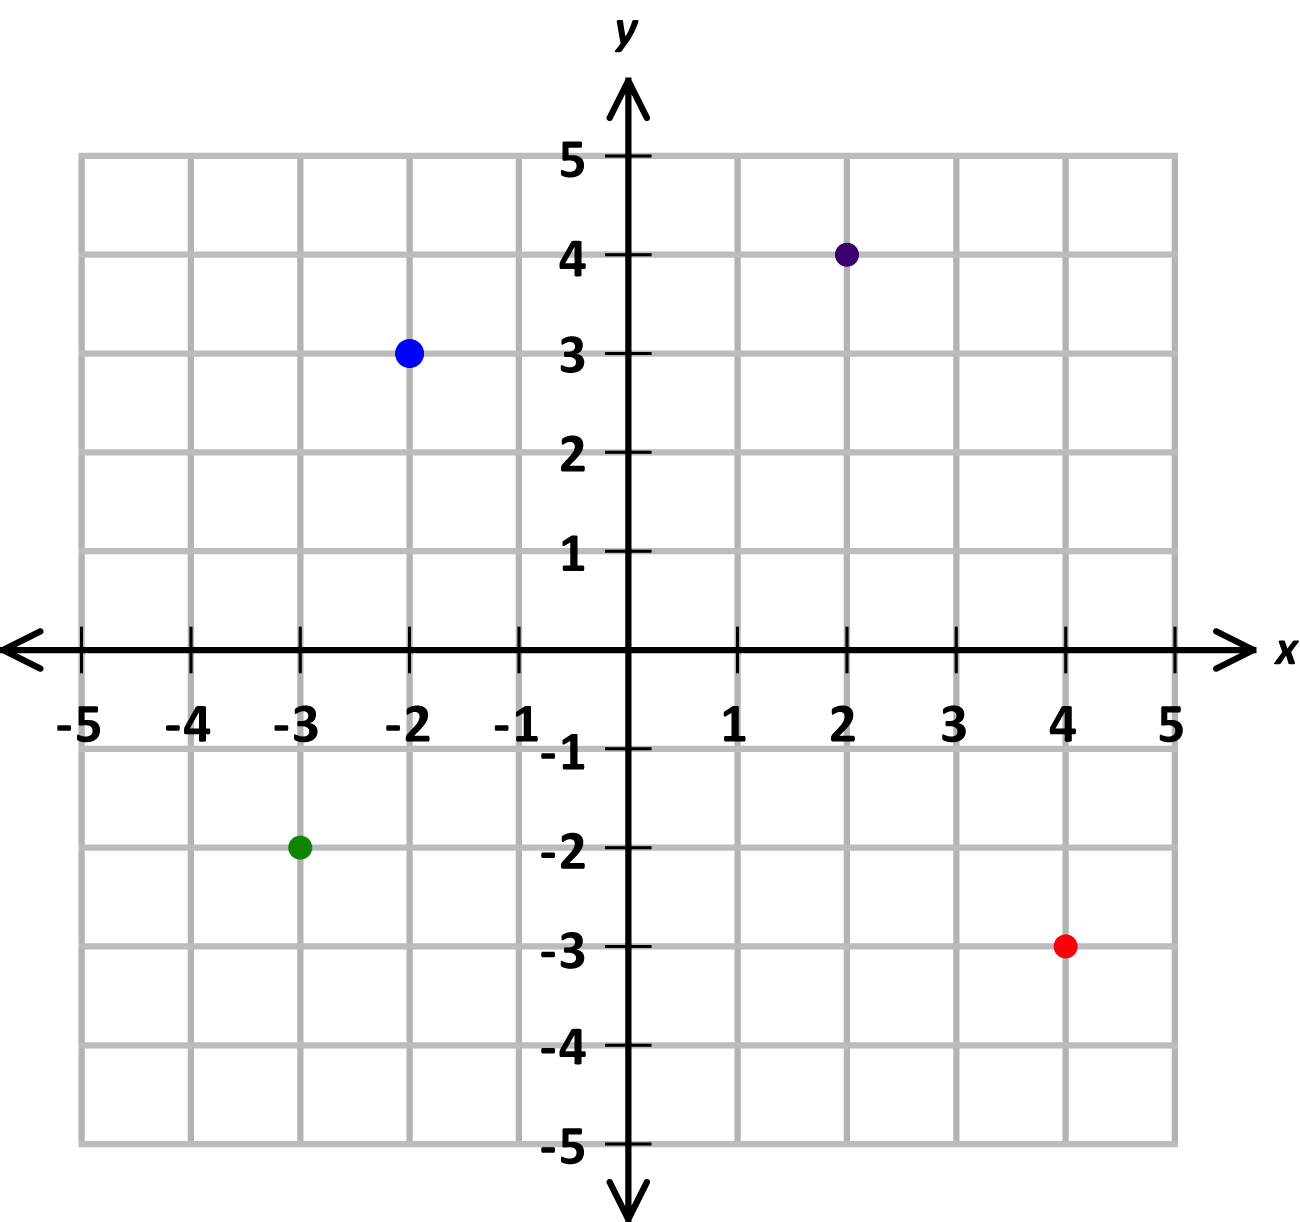
Which coloured point in the diagram has: (i) A negative x coordinate and a positive y coordinate? (ii) A negative x coordinate and a negative y coordinate?

Diagram

neg coord ex

Solution

(i) A point x coordinate lies to the left of the y axis so it's either the blue or green point. Points with positive y coordinates lie above the x axis so it's the blue point.

(ii) Using the same reasoning, the point with both coordinates negative is the green one.

Conversion graphs

Definition

A Conversion Graph helps us to convert one unit to another. For example we can use a graph to convert two currencies or metric to imperial measures

Method

Using a Conversion Graph is basically common sense. The key thing to remember to check the labels on the axes and to get the conversion the right way round.

Example

Use the graph to (i) find out how many kilometres are in 50 miles (ii) convert 220km to the nearest 10 miles.

Diagram

miles to km graph

Solution

(i) We're given the amount in miles so look up 50 on the x axis which represents miles. Go up to the graph at this point. Now, read the value of the y (ie. km) axis at this point. y = 80 so 50 miles = 80km

(ii) Look up 220km on the y axis. Move across to the graph at this point then drop down to the x axis. The value lies somewhere between 130 and 140, but closer to 140. As we're asked for the answer to the nearest 10 miles, 140 miles is our answer.

Drawing graphs from tables

Definition

A graph is a visual representation of an equation which describes how two variables, usually x and y are related. To draw a graph, it's often useful to work out some values of x and y that fit the equation, plot these points and then join the plotted points up to make the graph.

Method

The equations in this module are of linear graphs (ie. there's no squares or cubes or powers other than 1 in it), so 3 points are sufficient to plot them.

Draw a table for x, y values of the graph and work out each y by substituting the x value into the given equation. Once your table's complete, plot the points and then draw a line through them with a ruler.

If a straight line doesn't pass through them then you've made a mistake. Check through the values in the table to find the error.

Example

(i) Draw a table of values for x = -2, -1, ... 3 for the graph y = 2 - x (ii) By considering points in the table, which coloured line represents this graph?

Diagram

draw graph ex

Solution

(i) Your table should look like this:

Diagram

tab y eq 2 - x

Note

(ii) Looking at the table, the graph passes through the points (0, 2) and (1, 1). The line that passes through those is the green one so that's the line for y = 2 - x

Travel graphs

Definition

A Travel Graph is a visual representation of a journey. The time is represented on the x axis and the distance travelled on the y axis.

Method

These are very straightforward. The trickiest thing you may be asked is to work out the average speed for the journey. Don't forget that

If a section of a travel graph is a horizontal line, that means that time has elapsed (the x value has increased) but no distance has been travelled (the y value hasn't changed).

Example

Anita is travelling to San Diego from London. In order to get the cheapest flight, she has had to fly via Hamburg, New York and San Francisco before connecting to San Diego. (i) How much time has she spent waiting at airports? (ii) What was the average speed of the flight from Hamburg to New York?

Diagram

london san diego

Solution

(i) Time waiting is denoted by horizontal lines on the graph. So, the waits at each airport are as follows: 3 hours London 1 hour Hamburg 2 hours New York 2 hours San Francisco So in total, she's spent 8 hours waiting at airports.

(ii) The flight to New York started after 5 hours and lasted until 12 hours so it took 7 hours. Looking at the y axis, the distance from Hamburg to New York is (4000 - 500) = 3500. So, the average speed was 3500/7 = 500 mph

Linear graphs

Definition

As the name suggests, a Linear Graph is a line. It has the equation y = mx + c where m,c are constants. m is the gradient of the line and c is the y-intercept.

Method

Not only do you need to be able to draw a line given its equation, but you also need to be able to determine the equation of a line by looking at its graph.

This is not as hard as it sounds. All linear graphs can be written as y = mx + c so all you have to do is work out m and c from looking at the graph. Finding c is straightforward. Look at the value of y when x = 0 ie. where does the graph cross the y axis?

Once you've found c, find another coordinate on the line and put its x,y values into the equation. Now you'll be able to work out m

Follow the worked example below to see this in practice.

Example

Find the equation of the blue line.

Diagram

2y eq x pl 2

Solution

It's a straight line graph so its equation is of the format y = mx + c

Looking at the graph, when x = 0, y = 1 Putting those values into the equation, 1 = c so, y = mx + 1

Now look at the point (-2, 0) which is also on the graph. Put these values into the equation to get 0 = -2m + 1 so m = 1/2

So, the equation of the given line is y = x/2 + 1

Line lengths and mid-points

Definition

Given the coordinates of the end points of a line, it's possible to find the Length of the Line and its Mid Point.

Method

First, let's consider the easy cases - the lengths of horizontal and vertical lines. The end points of a horizontal line will have the same y coordinates so its length is the absolute value of the difference of its x coordinates. The length of a vertical line is the absolute value of the difference between its y coordinates.

OK, now let's assume the line is diagonal and let the end-points have coordinates (A,B), (C,D)

Draw a sketch of the line and complete the right angled triangle with point (P, Q)

Diagram

line length and mid pt

Note

The coordinates of the point (P, Q) are (C, B) (If we'd drawn the triangle the other way, the coordinates of PQ would be (A, D))

So, we have a triangle with vertices (A, B), (C, B) and (C, D) The line joining (A, B) to (C, B) is horizontal so its length is |C-A| Similarly, the length of the line between (C, B) and (C, D) is |D-B|

Using Pythagoras' theorem: (Hypotenuse)² = (|C - A|)² + (|D - B|)² = (C - A)² + (D - B)² Take the square root for the answer.

To find the mid point is much simpler. Simply take the average of the x coordinates andy coordinates of the end points of the line ie. ( (A+C)/2, (B+D)/2 )

Example

Find the length and mid point of the line with end points (1, -4), (-5, 4)

Solution

First draw a diagram.

Diagram

line len mid pt ex

Note

The third point of the triangle has coordinates (1, 4) So, if L is the length of the given line, using Pythagoras' theorem: L² = (1 - (-5))² + (-4 -4)² = 6² + 8² = 100 So, L = 10

Now for the mid point, its coordinates are the averages of the coordinates of the line's end points ie. ( (1 + (-5))/2 , (-4 + 4)/2 ) So the mid point is (-2, 0)

Gradients

Definition

The Gradient of a line is how much it slopes. Mathematically, it's the measure of how much y changes relative to x The gradient of a line joining two points (A, B) and (C, D) is: (D - B)/(C - A) that is, (Change in y)/(Change in x)

Diagram

neg pos grad

Note

If the gradient of a line is positive, it slopes upwards from left to right (red line) If it's negative, it slopes downwards from left to right (blue line)

The equation of a linear graph can always be written in the form: y = mx + c The gradient is equal to m

Method

To find the gradient of a line, you just need to know the coordinates of two points on the line. You may be given them in a question, or you may need to find them be looking at a graph.

When you have the points, (A, B), (C, D), use the formula: Gradient = (D - B)/(C - A)

Tips/hints

Find two points that have whole number coordinates if possible.

Example

Find the gradient of the line shown

Diagram

4y eq 8 - x

Solution

First, find the coordinates of two points on the line. Here, the intercepts are quite friendly so let's use those.

The intercepts are (0, 2) and (8, 0) So, the gradient is ( 0 - 2 )/ ( 8 - 0 ) = -2/8 = -0.25

Real-life graphs

Definition

Often it's helpful to look at information in graphical form. For example the back of a utility bill might use a graph to show how the amount on your bill rises with the fuel you use. Real-life Graphs help us to make sense of the real world.

Method

Use your common sense. Read the labels and understand what the graph represents.

Example

A taxi firms charges a flat call out fee and then a fixed rate for each mile travelled. Looking at the graph below, work out: (i) The total cost of a journey of 10 miles (ii) The distance travelled on a joruney costing £8

Diagram

taxi ex

Solution

(i) To find the cost of a journey of 10 miles, simply go along the x axis (which represents miles) to 10. Look at the graph at this point and read along to find the y value (cost). It's £17.

(ii) This time we're given the cost, ie. a value on the y axis. Look up 8 on this axis and go along to the graph. Drop down to the x axis at this point and read the value, 4. So, a journey of 4 miles costs £8.

Cover-up method for drawing graphs

Definition

There are a number of different ways to draw a Linear Graph. The one described here is known as the "Cover-Up Method" or the "X = 0,Y = 0 Method". A Linear Graph will have an equation of the form y = mx + c. To plot it, we need just 2 points. In this method of graph drawing the first point we use is when x = 0, the second is when y = 0

Method

Using the equation y = mx + c, when x = 0, y = c so our first point is (0, c). Putting y = 0, we get x = -c/m so the second point is (-c/m, 0).

Just plot those and draw a line through them. That's it. Look through the worked example to see how straightforward it is.

Example

Which two points should you plot to use the 'X = 0, Y = 0 Method' of drawing the line x - y = 2?

Solution

First, set x = 0 to get -y = 2 so y = -2 making the first point (0, -2). Now set y = 0. This gives x = 2 so the second point is (2, 0)

Drawing quadratic graphs

Definition

A Quadratic Graph is one with the equation y = ax² + bx + c. Depending on the sign of a, it will look like a valley (a positive) or a mountain (a negative). The mathematical term for the shape of a quadratic graph is a 'parabola'

Diagram

quad graph valley mountain

Method

The easiest way to Draw a Quadratic Graph is to set up a table of values for x, y at various points, plot the points and then join them with as smooth a curve as possible.

You should be told which range of values to plot the graph over.

Tips/hints

A quadratic graph is always symmetrical about a vertical line through the turning point (ie. through the top of the mountain or the bottom of the valley depending which way up the parabola is).

As with any graph question, don't forget to label everything.

Example

Complete a table of x, y values for the quadratic equation y = x² - 6x + 5 for -1 ≤ x ≤ 7 and use this to draw a graph of the function.

Solution

Your table should look like this

Note

tab x2 -6x pl 5

Use these points to plot the graph

Note

y eq x sq min 6x pl 5

See how the bottom of the parabola is at the point (3, -4) and the curve is symmetrical about the vertical through this point.

Reading Values from quadratic graphs

Definition

As with any graph, a Quadratic Graph can be used to find the value of one variable given the other. Because the graph is symmetrical about the vertical, for each value of y (except the turning point), there will be two values of x

Tips/hints

Make sure you use the scale correctly and be careful when reading negative values.

Example

Use the graph to find the values of x for which y = 8

Note

y eq x sq min x min 4

Solution

Note the question says 'find the values' ie. there's more than one. If it helps, put your ruler along the graph at the line y = 8. The graph passes through this line twice, once when x = -3 and once when x = 4

So the answer is x = -3, x = 4 You can check this by putting each value into the equation and seeing what the resulting value of y is - it should be 8.

Using graphs to solve quadratic equations

Definition

The roots of the Quadratic Equation ax² + bx + c = 0 are simply the x coordinates of the points where the graph y = ax² + bx + c crosses the x axis ie. when y = 0

Diagram

quad graph roots

Note

So, using the graph, the solutions of the equation x² + 4x - 12 = 0 are x = -6, x = 2

Tips/hints

Some graphs don't cross the x axis, they just touch it.

Note

y eq x sq min 4x pl 4

In this instance, there is only one root of the equation (in this case it's x = 2)

Example

Use the graph shown to find the roots of the equation 2x² = x + 3

Diagram

quad roots ex

Solution

First, rearrange the equation given to see that it's 2x² - x - 3 = 0, ie. the same as the graph.

Diagram

quad roots sol

Note

The solutions are the x coordinates of the points where it crosses the x axis ie. where y = 0. So, the solutions of 2x² = x + 3 are x = -1, x = 1.5

Test yourself on this topic

Try the free quiz with worked solutions.

Start quiz →

Get GCSE Algebra

Full notes, full question bank, offline.