Uses of graphs-solving linear simultaneous equations
Definition
In the same way that any (linear) equation of the form y = mx + c can be represented as a graph, so can any pair of linear simultaneous equations. Their solution is given by the point of intersection of the lines. If the lines don't intersect, then there is no solution to the equations.
Method
If you're asked to solve a pair of simultaneous equations graphically, draw the graphs in the usual way and find their point of intersection. The coordinates of this point give the solution to the equations.
Tips/hints
Always substitute your answer back into the equations in the original question to check it.
Example
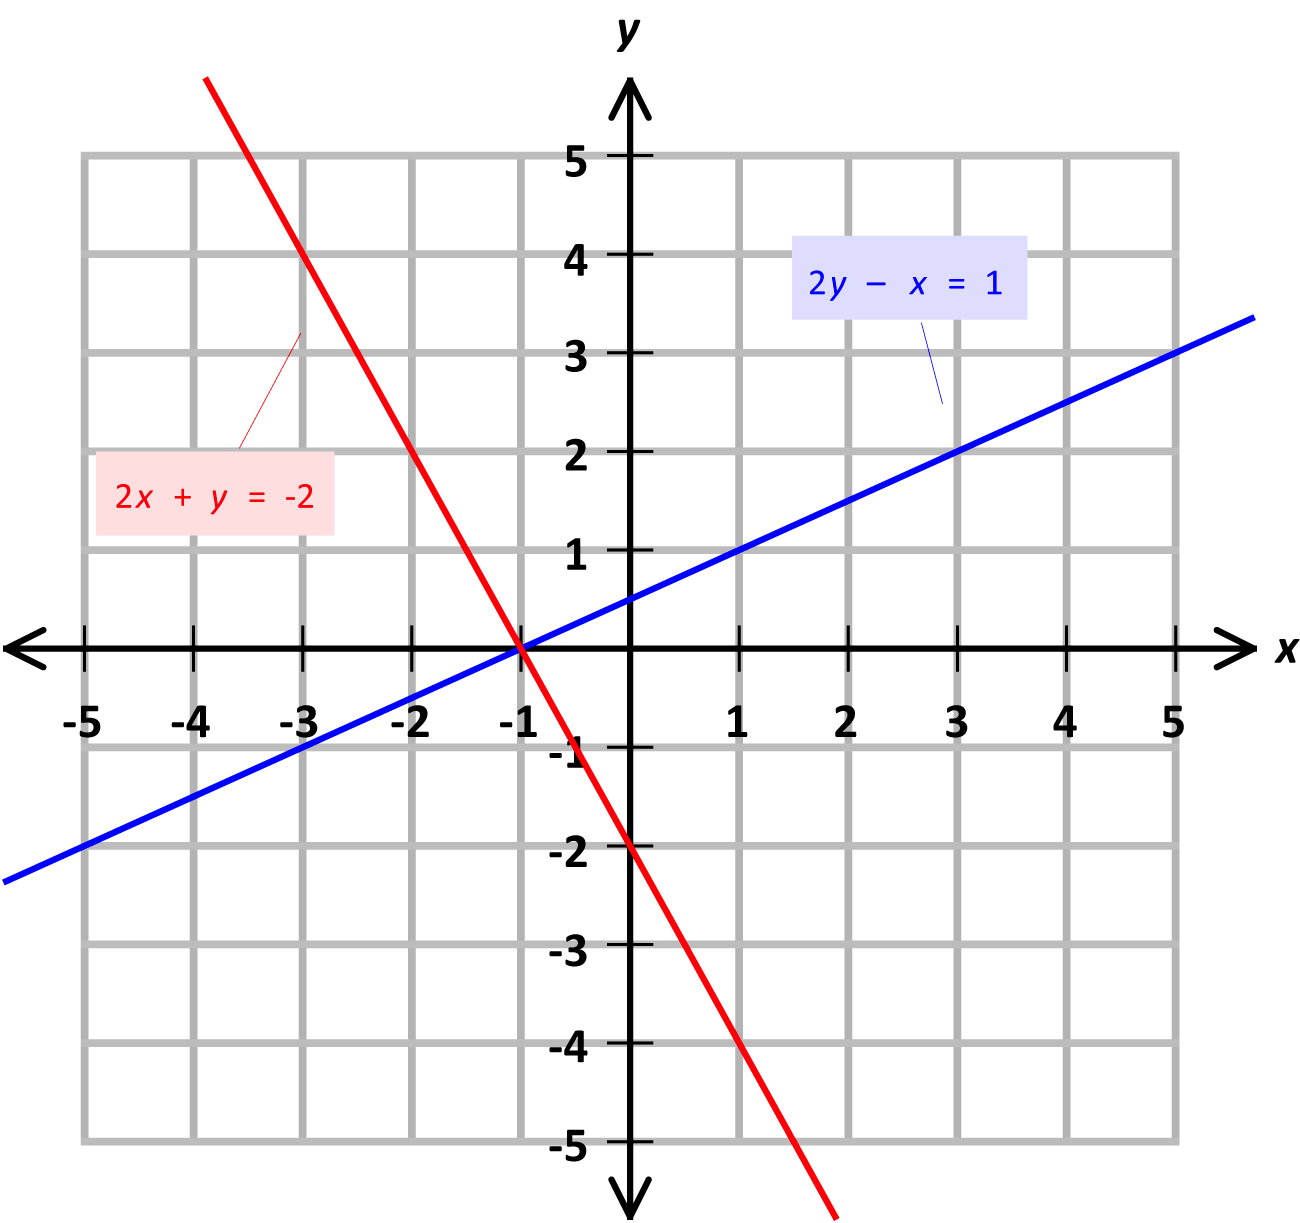
Using the graph, what is the solution for the pair of simultaneous equations: x = 2y - 1 2(x+1) = -y
Diagram
Solution
The equations we're given don't seem to match the lines on the graph but, try rearranging them. You'll get: 2y - x = 1 (the equation of the blue line) 2x + y = -2 (the equation of the red line)
So, the graphs are the equations we've been given. The solution is the point of intersection ie. (-1, 0), x = -1, y = 0 Substitute these values into the equations in the question to check your answer.